By Andy Sachs, The Encore Team at Compass
Every fall, someone asks me the same question at the transfer station or in line for coffee: "If I'm going to sell, when should I list?" It's a fair question, and most of the answers out there are national rules of thumb. So I pulled the numbers for our area — the greater Newtown–Danbury market.
That means single-family homes in Newtown (including Sandy Hook), Bethel, Brookfield, Danbury, Monroe, Southbury, Redding, Easton, Woodbury, and Oxford. Here's what the sales data says, and what it doesn't.

What the data says about listing season
I looked at every single-family listing in those ten towns that went live between November 2024 and June 2026 and sold by October 23, 2026, grouped by the month it hit the market. Mobile homes are excluded. Figures below are my calculations from SmartMLS closed-sales exports.
When the listing went live | Homes sold | Avg. sale price vs. final list | Share that sold over list |
|---|---|---|---|
February–April | 848 | 102.0% | 56.1% |
May–June | 762 | 101.3% | 53.5% |
July–September | 470 | 100.4% | 43.0% |
October–January | 591 | 100.4% | 45.7% |
Source: SmartMLS, 10-town single-family (mobile homes excluded), listings started Nov 2024–Jun 2026 that closed by Oct 23, 2026. Sold listings only. Sale-to-list averages exclude a handful of ratios under 50% or over 150% as likely data-entry errors. (my calc)
The late-winter and early-spring launch window still stood out across our market. Homes that hit the market February through April averaged 102.0% of list (848 sales). July through September averaged 100.4% (470 sales). So yes, spring gives sellers a tailwind — about 1.6 points relative to list, on a much larger sample than Newtown alone.
Now, the honest caveat. These numbers only include homes that sold. Listings that expired or were cancelled aren't in them, so the slower seasons may look a little better on paper than they were. The season shows up more in price than as a guarantee of anything.
"The calendar gives you a tailwind. Your price decides whether you use it."
Timing helps. Pricing matters more.
Here's the number I'd put on every seller's refrigerator. Across our ten towns so far in 2026 (closings January 1 through October 22), single-family homes that sold without ever cutting their price closed at a median of 101.6% of their original asking price, in a median of 21 days (971 sales). Homes that needed a price cut closed at a median of 92.5% of their original price, and took a median of 66 days (290 sales). (my calc)
That's a correlation, not a guarantee. A home that needs a cut was often priced too high, needed work, or both. The cut didn't necessarily cause the lower result. But the pattern is hard to ignore. List in April at the wrong price, and you can give back everything the season offered you.
How each town compared
Town-level samples vary a lot. Use the ten-town totals for the main takeaway. Treat any cell with a small sample (about n under 20) as directional only — I don't draw conclusions from those alone.
Sale-to-list by town (list-start season)
Town | Feb–Apr avg vs list (n) | Jul–Sep avg vs list (n) |
|---|---|---|
Newtown (incl. Sandy Hook) | 102.7% (164) | 99.8% (94) |
Bethel | 101.7% (78) | 100.5% (40) |
Brookfield | 100.3% (84) | 100.4% (39) |
Danbury | 102.9% (174) | 100.7% (109) |
Monroe | 102.1% (88) | 100.6% (47) |
Southbury | 101.6% (83) | 99.3% (45) |
Redding | 101.8% (52) | 101.1% (27) |
Easton | 102.1% (48) | 103.0% (24) |
Woodbury | 99.5% (34) | 97.8% (18)* |
Oxford | 102.5% (43) | 100.7% (27) |
10-town total | 102.0% (848) | 100.4% (470) |
*Small sample (n under 20). (my calc) Same windows as the season table above.
Price cut vs. no cut by town (closings Jan 1–Oct 22, 2026)
Town | No cut: median % of original / DOM (n) | Cut: median % of original / DOM (n) |
|---|---|---|
Newtown (incl. Sandy Hook) | 101.7% / 21 days (170) | 92.2% / 70 days (49) |
Bethel | 101.0% / 22 days (103) | 91.7% / 61 days (19)* |
Brookfield | 100.1% / 28 days (95) | 94.7% / 86 days (24) |
Danbury | 102.4% / 21 days (188) | 93.2% / 56 days (48) |
Monroe | 102.9% / 21 days (94) | 94.3% / 54 days (41) |
Southbury | 100.6% / 16 days (97) | 92.6% / 73 days (37) |
Redding | 102.3% / 28 days (64) | 91.8% / 79 days (15)* |
Easton | 102.1% / 18 days (46) | 87.4% / 57 days (18)* |
Woodbury | 100.0% / 20 days (50) | 92.6% / 67 days (22) |
Oxford | 100.0% / 9 days (64) | 90.7% / 59 days (17)* |
10-town total | 101.6% / 21 days (971) | 92.5% / 66 days (290) |
*Small sample (n under 20). A price cut means the final list price was below the original list price. (my calc)
Local callout: Newtown
Zooming in on Newtown alone (including Sandy Hook), the same pattern shows up clearly:
- Listings that went live February–April averaged 102.7% of list (164 sales); July–September averaged 99.8% (94 sales).
- Homes with no price cut sold at a median 101.7% of original asking in 21 days (170 sales); homes that needed a cut sold at 92.2% after 70 days (49 sales). (my calc)
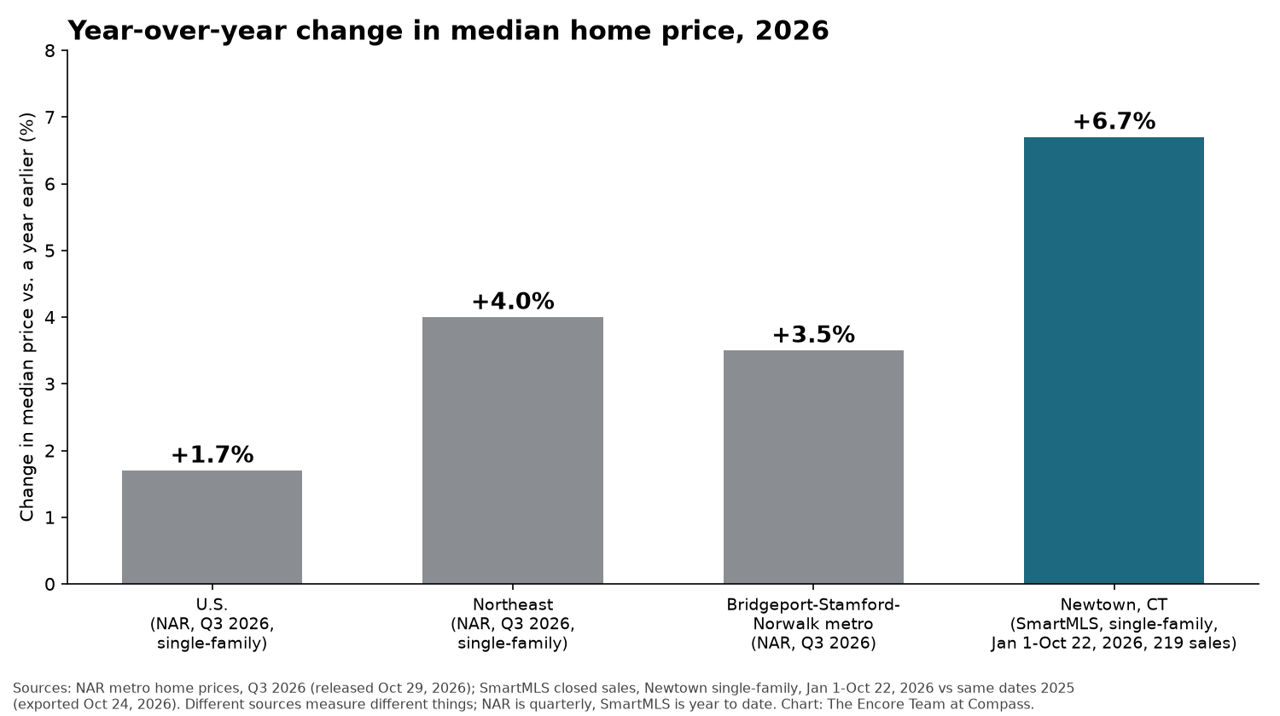
That Newtown read matches the earlier Newtown-only post; the ten-town totals above are the figures that back the spring reel.
What this means for sellers
If spring 2027 is on your radar, the prep window is now through January. That's when you handle repairs, declutter, line up photos, and, most importantly, settle on a price that's grounded in recent sales rather than wishful thinking. If you can't wait for spring, that's fine too. A well-priced home sells in any month. You just have less room for error.
What this means for buyers
The same data cuts the other way. Late-summer listings averaged closer to asking, and a smaller share of them sold over list (43.0% in July–September vs. 56.1% in February–April across our ten towns). If you can shop in the off-season, you may face less competition and find more sellers open to negotiating. Spring will bring more choices, but also more buyers bidding on the best ones.
The bottom line
There's no magic date that sells a house. Across Newtown, Danbury, and our surrounding towns, the local numbers do point to a real advantage for homes launched February through April — but they point even harder at pricing it right from day one. Get the price right, give yourself time to prepare, and the calendar becomes a bonus instead of a crutch.
I've spent over 20 years in Connecticut real estate and helped with more than 1,000 successful transactions, and every one reminded me that a timeline is personal. The full breakdown and a free market analysis are on my website, andyaroundtown.com. You can start with a free market analysis, or call or text me at 203-727-8621. I'd be glad to walk you through what the numbers mean for your home.
Frequently asked questions
When is the best time to list a home in the Newtown–Danbury area? Based on SmartMLS closed sales for listings that started between November 2024 and June 2026 across Newtown, Bethel, Brookfield, Danbury, Monroe, Southbury, Redding, Easton, Woodbury, and Oxford, single-family homes listed February through April averaged 102.0% of list price (848 sales), versus 100.4% for July through September (470 sales). Past results don't promise future ones, and pricing matters more than the date. (my calc)
How long does it take to sell a house around Newtown right now? Across those ten towns, single-family homes that sold in 2026 without a price cut reached a contract in a median of 21 days; homes that needed a cut took a median of 66 days (closings January 1–October 22, 2026, SmartMLS). Your home's timeline depends on price, condition, and location. (my calc)
Is it a bad idea to sell a house in the fall or winter? Not necessarily. Late-summer listings sold for a little less relative to list on average across our market, but there's also often less competition from other sellers. A home priced in line with recent sales can sell in any season. If you're deciding between now and spring, a free market analysis is a good first step.
Does Newtown follow the same pattern as the broader area? Yes. Newtown single-family listings that went live February–April averaged 102.7% of list versus 99.8% for July–September, and the no-cut versus cut gap was 101.7% in 21 days versus 92.2% in 70 days. The ten-town totals smooth town-by-town swings and are the figures used in the spring reel. (my calc)
Method and source
All market figures in this post are (my calc) from SmartMLS closed-sales data exported through my account:
- Seven Fairfield County towns (Newtown, Bethel, Brookfield, Danbury, Monroe, Redding, Easton): export dated October 24, 2026 (
fairfield_sold_*.csv), closings October 24, 2024–October 23, 2026. - Southbury, Woodbury, Oxford: export dated November 6, 2026 (
southbury_sold_2024-10-24_to_2026-10-23.csv,woodbury_sold_2024-10-24_to_2026-10-23.csv,oxford_sold_2024-10-24_to_2026-10-23.csv), same close-date window.
Filters: single-family only; mobile homes excluded (Style contains "Mobile"); sold/closed listings only.
Listing-season window: Start Marketing Date November 1, 2024 through June 30, 2026, closed by October 23, 2026. Average sale-to-list = Close Price ÷ final List Price. Ratios under 50% or over 150% dropped from the average.
Price-cut window: closings January 1–October 22, 2026. A price cut means final List Price was below Original List Price. Metrics are median Close Price ÷ Original List Price and median DOM (export DOM field, not cumulative DOM).
Sold-only figures can flatter weaker seasons because expired and cancelled listings are not included. Associations (for example, price cut vs. lower sale price) are correlations, not proof of cause. Medians and averages describe the market, not any one home. Nothing here is a promise of any particular result. For a property-specific read, use a free market analysis at andyaroundtown.com/home-valuation or andyaroundtown.com.